Summer 2014, Columbia University Graduate School of Journalism
Police Diversity Across America

For my final project for one of my data journalism classes this summer at Columbia University, I was inspired by the protests in Ferguson, Missouri and the coverage from publications like the Washington Post to examine police diversity across America. One article that caught my eye in particular was:http://www.washingtonpost.com/blogs/wonkblog/wp/2014/08/12/when-police-departments-dont-look-like-the-cities-theyre-meant-to-protect/. While the article did an interesting analysis of how law enforcement remains segregated in its pay grades, it did not map communities across America nor did it get down to the actual police force level. After surveying the web for several hours, I came across some data from the Bureau for Justice Statistics. The data was not extremely extensive. In fact, it only included police demographic data for approximately 7% of zip codes in America. Nevertheless, I worked with the data that I found and here is a link to my final presentation slides: Final Police Diversity.
The day after I presented the New York Times came out with this article using similar data: http://www.nytimes.com/interactive/2014/09/03/us/the-race-gap-in-americas-police-departments.html.
Please let me know if you have any questions about the project that I did. I am trying to post my maps (which are interactive) to Mapbox and will update this post with links once they are up.
The Maps: Click on each map to link to a Mapbox Interactive.
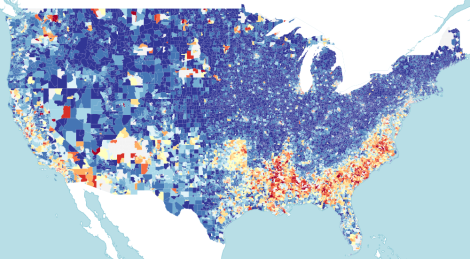
White vs. Minority Census Data Map

Whitest police forces in America

Difference between the whiteness of the police force and the whiteness of the population
Fall 2014, Columbia University Graduate School of Journalism
NYPD Misconduct 2009 – 2013
This year the NYPD released it’s 5-year data data on complaints placed against the city’s police department. This series of charts and graphs serve to highlight some of the key findings from that data. For the raw data, follow this link: http://www.nyc.gov/html/ccrb/html/news/reports.shtml.
Following the Michael Brown and Eric Garner cases this summer, the media across the country has been examining local police departments in various cities and analyzing what can be done to better protect and serve the communities they represent.
Every year, complaints are processed in New York City by the Civilian Complaint Review Board, where the allegations are assessed on the basis of whether or not they are able to be tried in a court of law. In 2013, there were 16,675 allegations of officer misconduct filed by the CCRB and only 5,410 (32%) were deemed to be complete complaints. These complaints are then reviewed for substantive evidence against the NYPD officer. If the complaint is found to be substantiated, the case is handed over to the NYPD to divide into three disciplinary categories: charged, disciplined and instructed. These three levels of punishment (listed from most severe to least) are telling of how the NYPD ranks certain violations within the department and how easy or hard it can be for officers to get away with different types of misconduct.

For complaints that are substantiated, the majority of officers are charged, and this has been the case across all five years of data.

Situations in which police fired their guns was the most frequent cases in which they were exonerated even though the complaint was substantiated. While this is alarming, it also must be noted that this scenario of complaint (“gun fired”) is one of the smallest categories for complaints across all five years.

The darker the red, the more substantiated cases there were of the specific NYPD offense. The longer the bullet graph along the x-axis, the more likely it was that police were exonerated from the listed complaint when the abuse of power did occur. With this, we understand that police that entered or searched premises unlawfully were most likely to be exonerated over all other offenses but the most substantiated offenses (i.e. retaliatory arrests and summons) were the least likely to be unpunished.
What else you need to know about NYPD misconduct complaints:

It must be noted that overall, complaints against the NYPD have decreased within the past five years.

Over the five-year period between 2009 and 2013, Bed Stuy and Crown Heights were tied for the largest number of registered complaints against NYPD officers. The darker green and bigger the square, the more cases of complaints against the NYPD existed within the neighborhood. Please note that this tree graph is in no way adjusted for population within each neighborhood and does not reflect how many of the complaints were actually substantiated once tried in court.
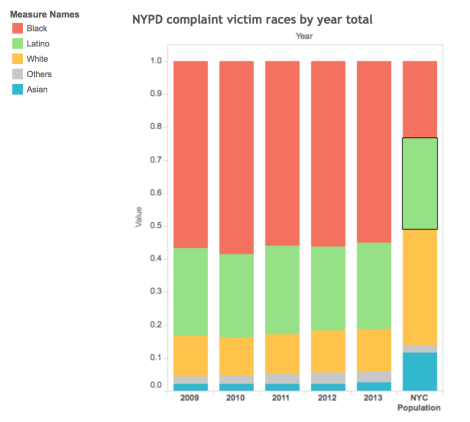
Since 2009, the black population in New York City has registered the most complaints against the NYPD, even though they are a smaller population than both the white and Latino communities in the city. Though not clear within the graph, the y-axis represents the percent of the total NYC population.

Over the five-year period, the most frequent allegations against the NYPD occurred in situations where people were stopped on the street for suspected wrongdoing. To better see the other categories for complaints, click on the graph to go to the Tableau Interactive version of this graph.

With gun violence and police armament abuzz in the news recently, it is important to note that in New York City gun shots are some of the smallest police misconduct complaints even though gun pointed complaints have remained the highest since 2011.

Pingback: 2014 – Eric Garner NYC protests | Robyn Spector Photography·